Quick Start
Here we'll lay out a path from invite to dashboard in a fresh Omni environment. We won't deep dive into each section, but follow links to learn more about modeling, dashboard building, or other topics.
Getting an Invite to Omni
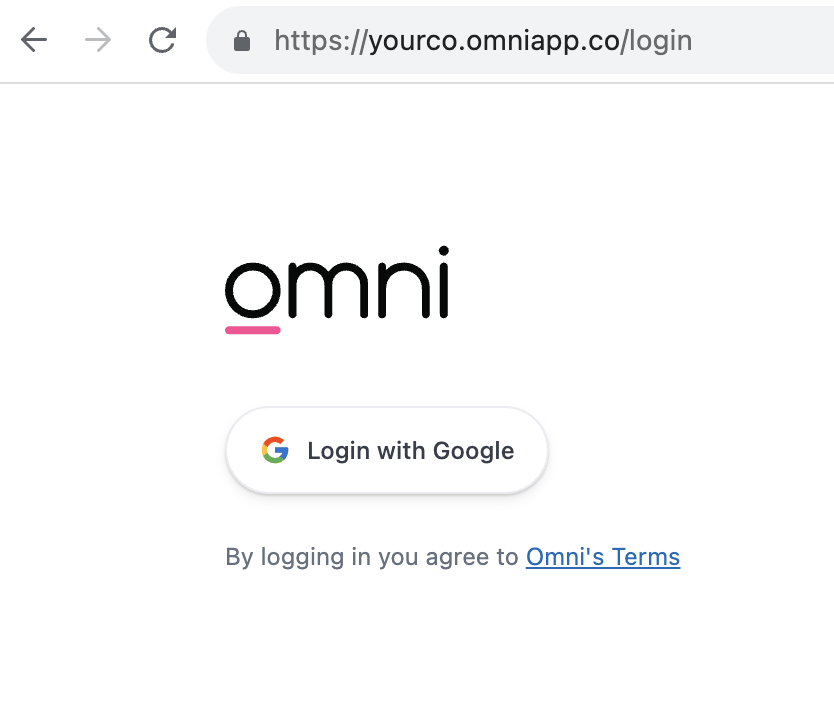
You'll first need to navigate to your organization's omni environment. It will likely be of the form yourco.omniapp.co. Here you'll be presented a login option:
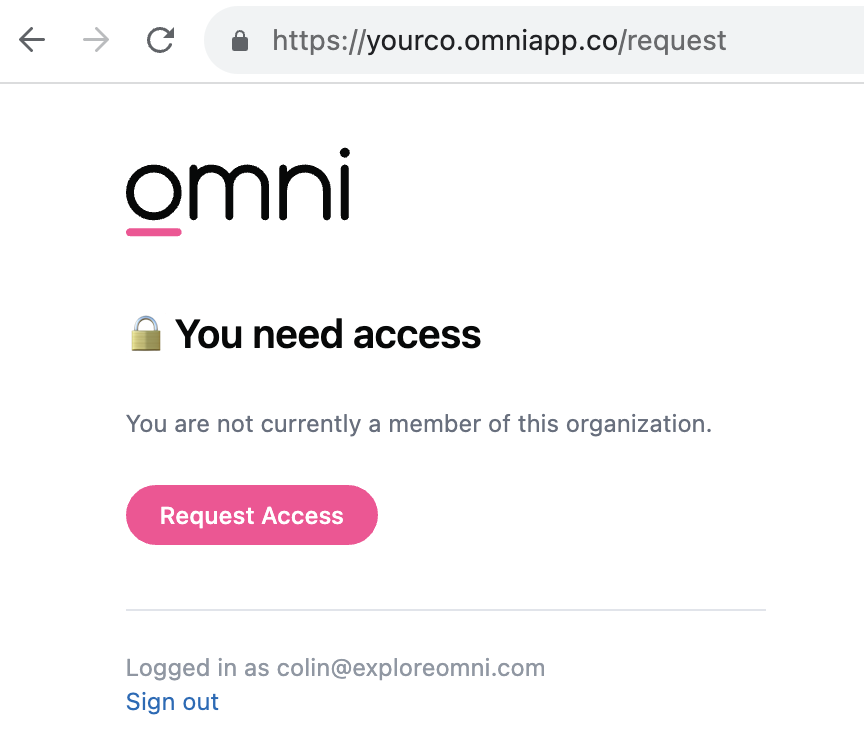
After following the login, if an account has not been created, you will need to request an invite from an admin in your system:
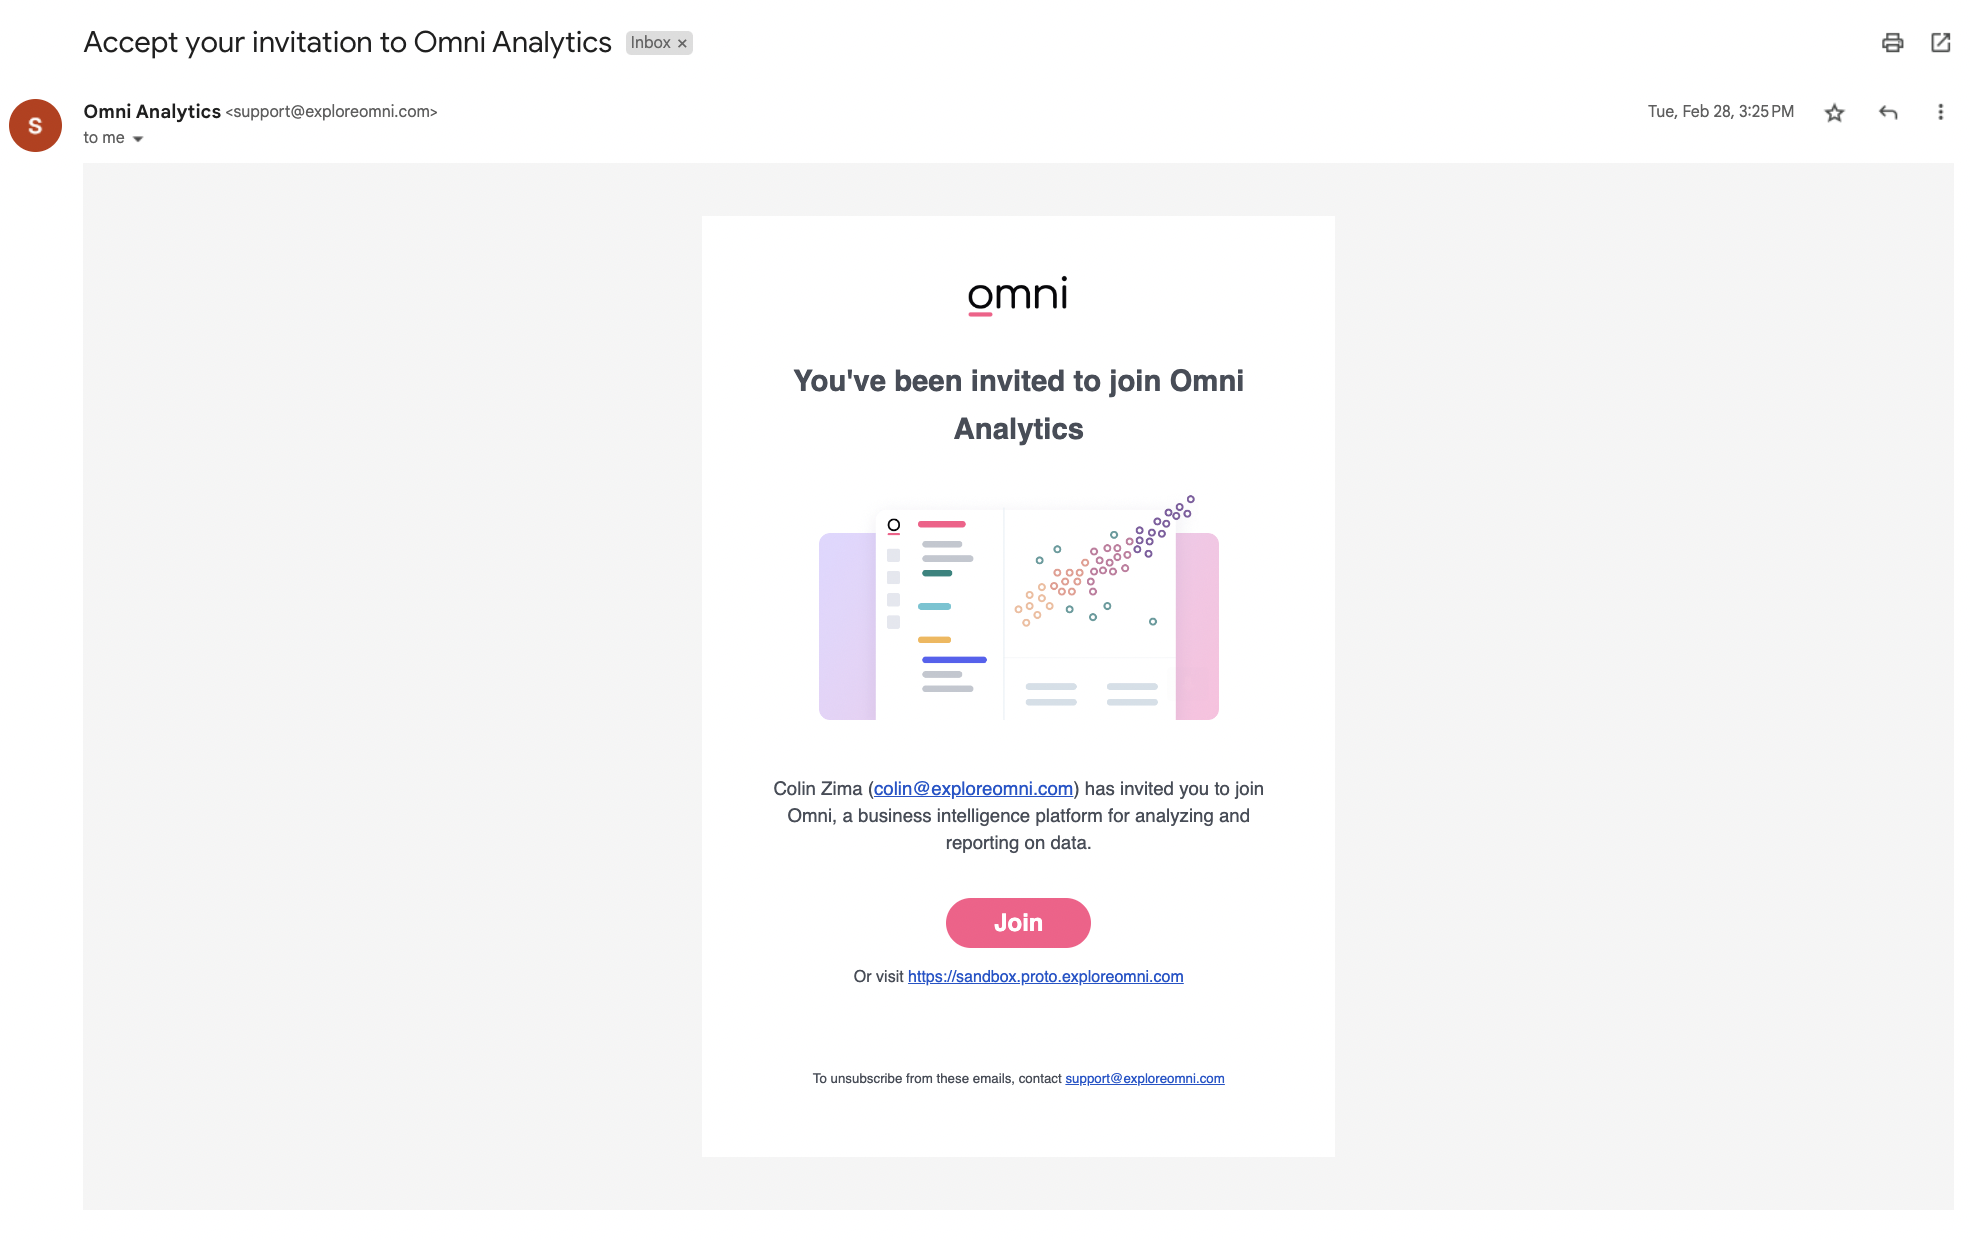
Join Omni
Next we need to accept our invitation to Omni.
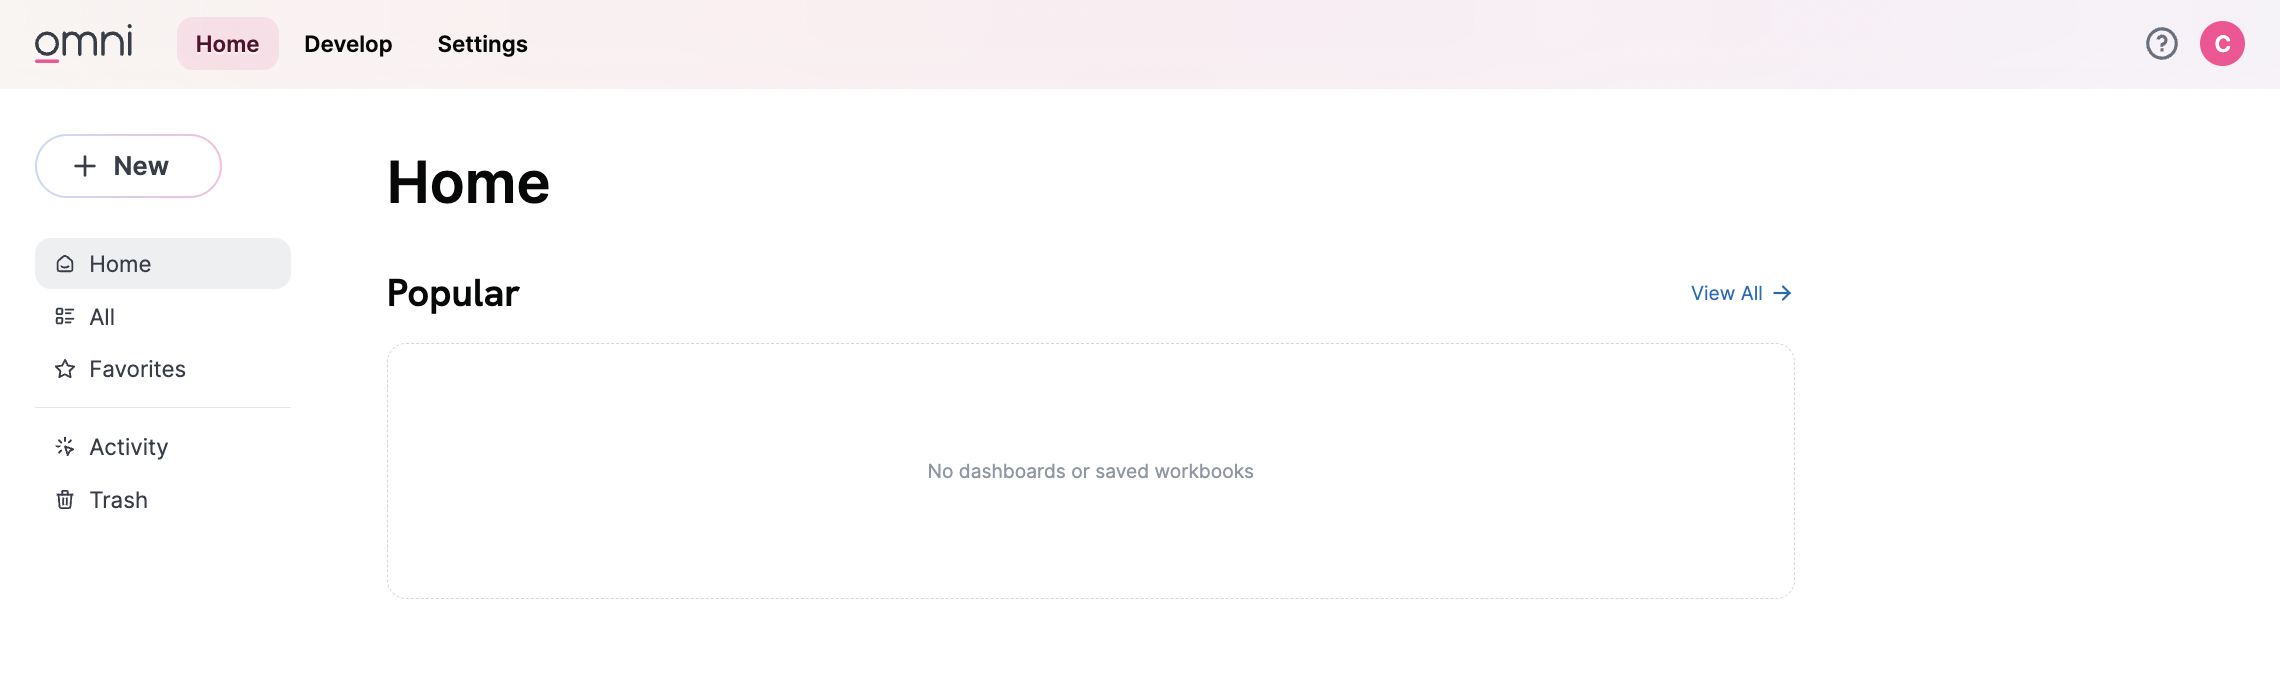
For our first user the landing page will be pretty barren, we can follow the banner or top navigation to get Omni connected to our database.
You'll need some credentials to connect your database, for more detail, see connection instructions. Now we're ready to start asking some questions.
There can be permission or configuration issues getting your DB connected. Reach out to the Omni team if you need help troubleshooting.
Our First Query
The next step is to start asking some questions. We can start querying by selecting "New" from the homepage. We'd also be able to select between different datasets here if more database connections are available.
Omni will generate one topic automatically. Topics curate the querying experience to a specific base table, to make end-user self service simple. Here, we have a topic about Order Items:
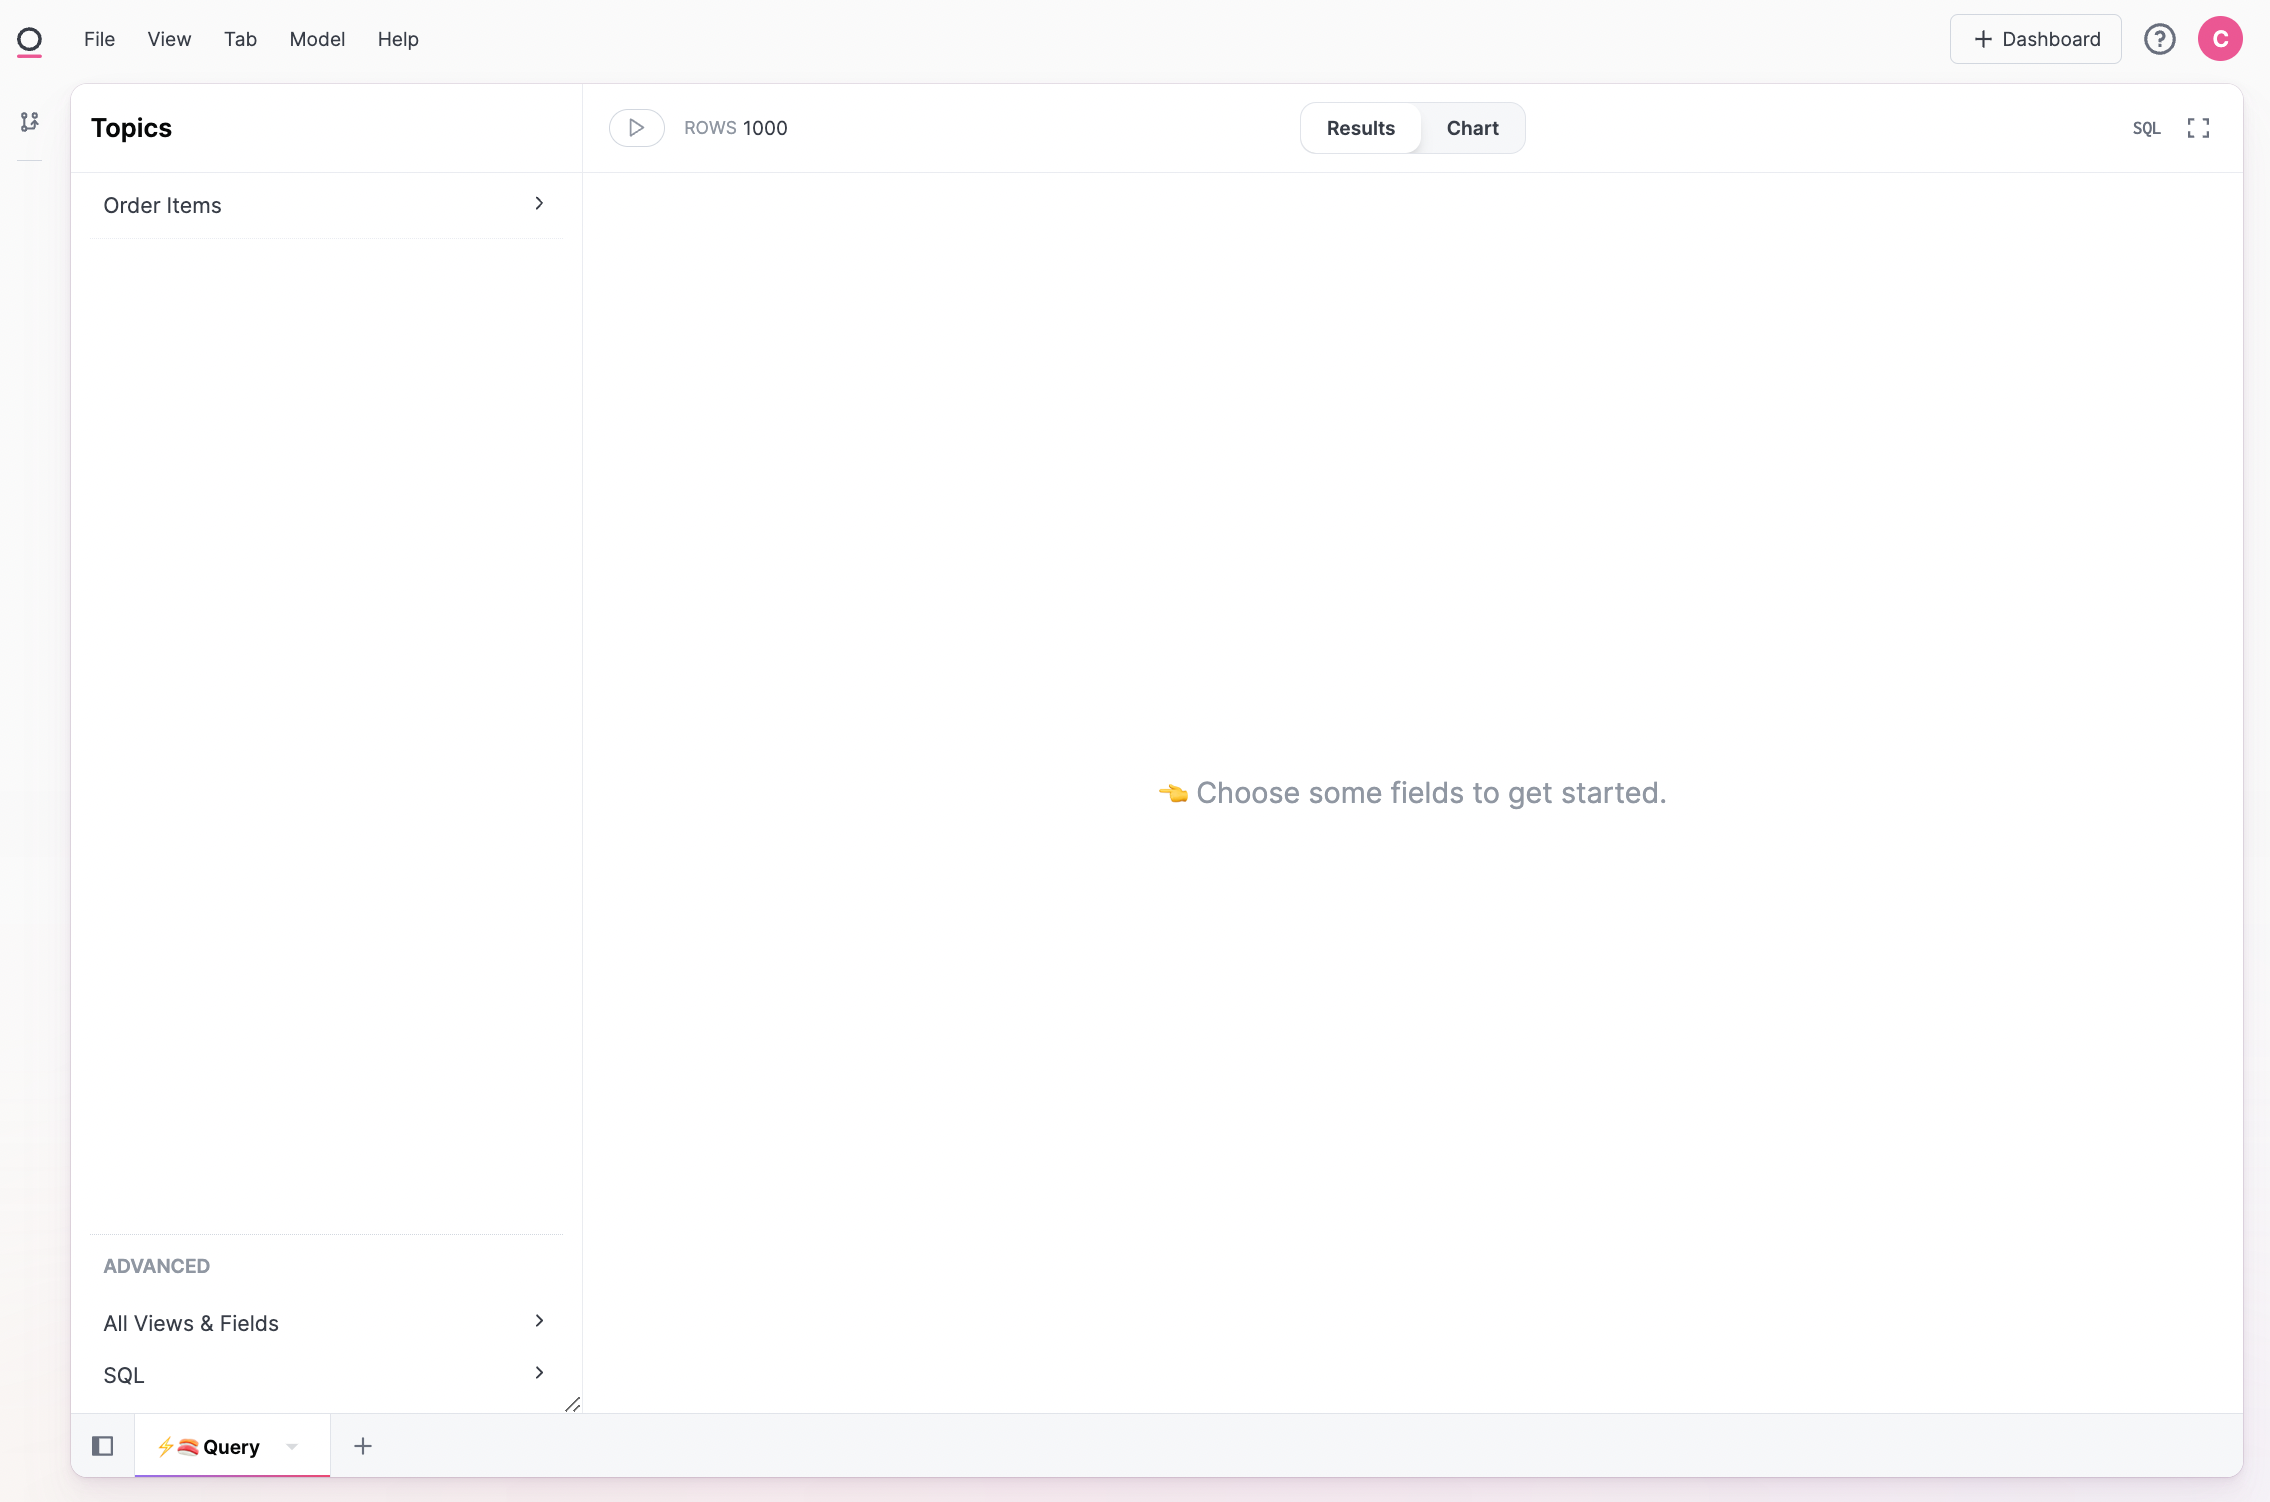
Topics will query a single base table, but also allow faceting the data set by other related tables:
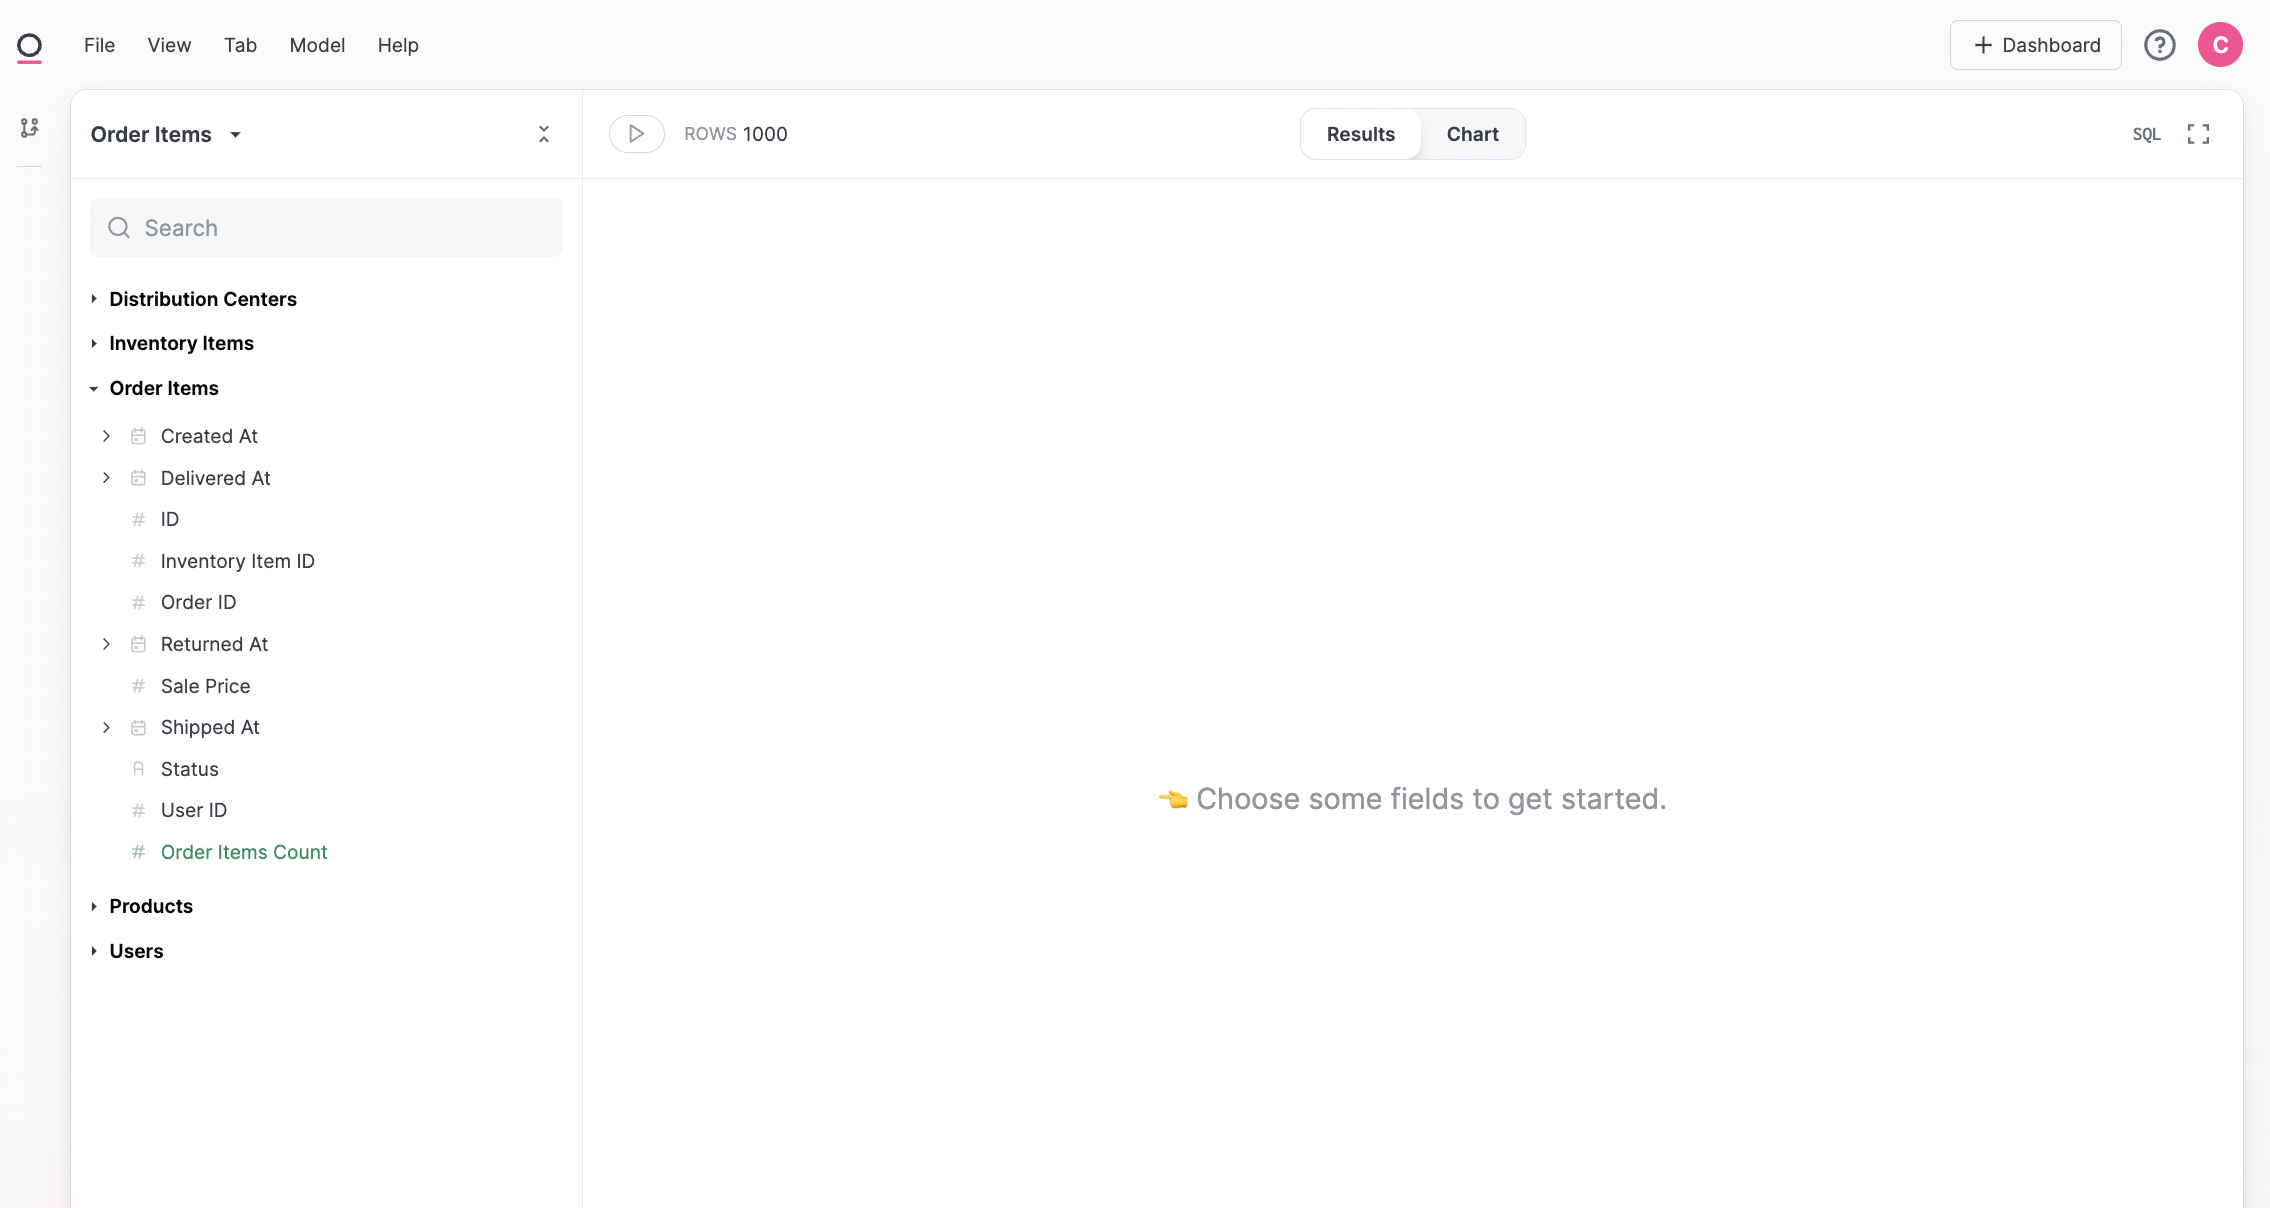
Via simple point and click we can build our first query. We can also visualize our data and configure our chart:
Our First New Topic
We may want to start exploring a new data set. Building topics is an easy way to start down this path. First, let's create a new tab and take a look at all the tables in our database:
This warehouse is small, but maybe we want to learn a bit more about our users. We can query directly from here, or make a new topic from the field picker:
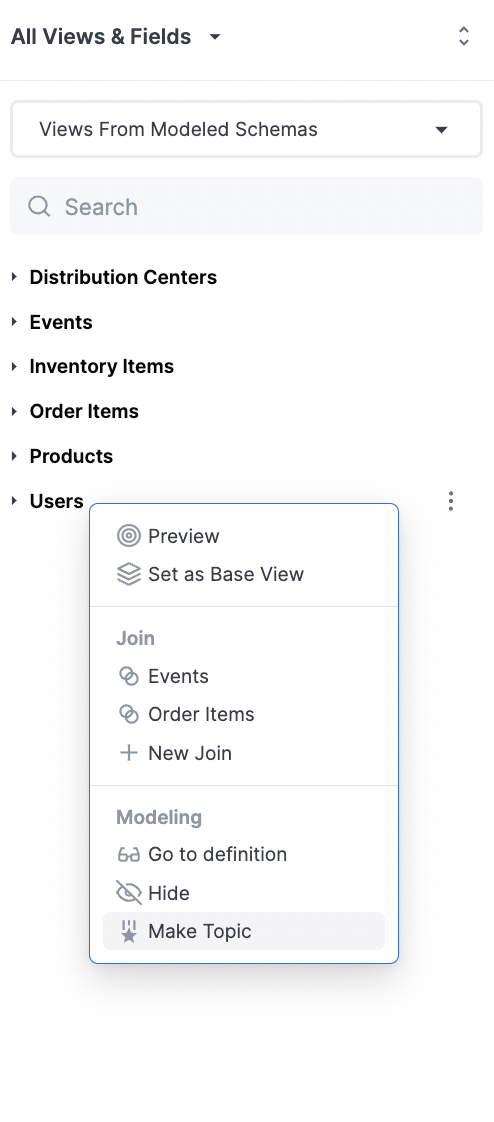
This will create a new topic where we can ask questions about users:
By making a topic, we have started modeling our data! We can see all of our changes in the workbook's sidebar. For now that change is contained to our workbook, but let's share that change with everyone:
Let's also build a quick fact table and join in back to users. This one we won't promote to the main model:
We've now done a bit of modeling in both the shared layer and the workbook. Let's build a dashboard.
Building Our First Dashboard
To get started we'll build a couple cuts of our data to visualize in our workbook (including our old fact table):
From there, we simply create a new dashboard and arrange our tiles, we'll also hide our fact table and adjust a chart back in the workbook:
We can also link up filters to make the dashboard more interactive, we'll also set a default value to "USA":
From there, sharing is as easy as passing around URLs, but if we want to curate our user experience, we can also pin this dashboard to everyone's homepage:
In Closing
There is much more to dig in to around modeling data, building rich visualizations, or user management. Don't hesitate to reach out with questions.